The Throttle
How I decide when to press and when to let off

How I decide when to press and when to let off
There's a question underneath every trading decision you'll ever make, and almost nobody answers it with rules.
Not what do I buy. Not where's my stop. The question is: how much should I have on right now?
Most of us answer it with a feeling. The market feels good, so we push. We get burned, so we pull back, usually a week after we should have. Then the tape recovers and we're sitting in cash watching it go, so we push again at exactly the wrong moment. I spent the better part of two years doing that, and I have the equity curve to prove it.
I don't answer it with a feeling anymore. I answer it with two throttles: one that reads the market, and one that reads my own account.
Why I needed a rule and not an opinion
I have a full-time job. I'm not watching charts at 10:40 on a Tuesday, and I can't react to a market that turns against me at lunchtime.
That sounds like a handicap. It's the opposite. It forced me to build something most full-time screen-watchers never bother with. If you can react all day, you can get away with having no exposure policy, because you'll just handle it live. I can't. So my exposure has to be decided before the week starts, from rules I set when I was calm, on a Saturday morning, with nothing at stake.
The principle my whole playbook is built on is four words: we do not predict; we align. I hold no opinion on where the market is going. I read what price is doing and follow it. The throttle is how that alignment becomes a number instead of a mood.
The first throttle: the market's condition
No stock gets evaluated before the market does. I compare two indexes.
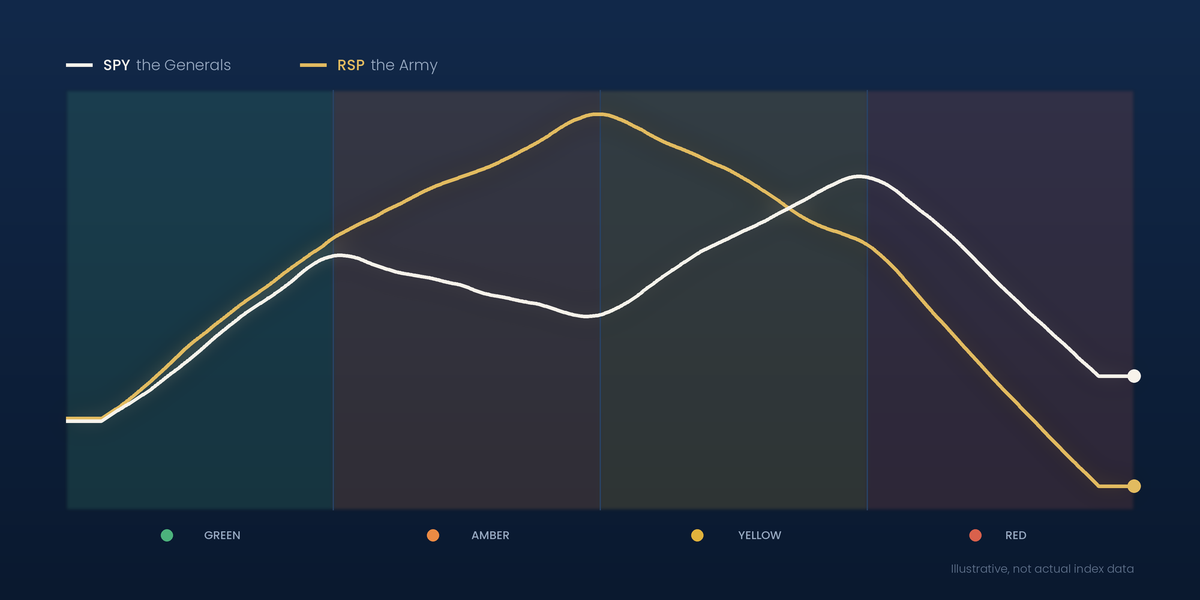
SPY is the S&P 500 weighted by market cap. The Generals: mega-cap leadership.
RSP is the same 500 companies weighted equally. The Army: the breadth of the market.
When both rise together, the market is healthy. When they diverge, the divergence is the signal. That's the whole insight, because most traders only watch the Generals. SPY can be green for weeks on the back of six enormous companies while the average stock quietly bleeds. If you trade mega-caps, SPY is your tape. I don't. I trade breakouts in mid and small-cap names, so RSP is the tape I actually live in.
This is why a trader can stare at a green index and not understand why every breakout he touches fails. He's reading the Generals and trading with the Army.
The Traffic Light turns that relationship into a deployment instruction:
| Light | What the two indexes are doing | What I'm allowed |
|---|---|---|
| 🟢 Green | SPY above a rising 21 EMA and RSP above a rising 21 EMA | Full participation. 100%+ exposure, all entry types. Open risk ceiling 5.0%. |
| 🟠 Amber | SPY below or at a flat or declining 21 EMA but RSP above a rising 21 EMA | Rotation. 50 to 80% exposure. Avoid mega-caps and index ETFs. All entry types, tighter ceiling: 3.0%. |
| 🟡 Yellow | SPY above a rising 21 EMA but RSP flat or below its 21 EMA | Hidden weakness. Minimal exposure, reduced sizing, A+ setups in strong groups only. Tighten trailing stops. Ceiling 3.0%. |
| 🔴 Red | SPY below a declining 21 EMA and RSP below a declining 21 EMA | Systemic distribution. 100% cash. No new entries of any type. |
Amber and Yellow are the two that repay study, because they're mirror images and most people would read them backwards.
Amber is the Generals failing while the Army holds. That sounds alarming, but it isn't. It's rotation. Money is leaving the mega-caps and going somewhere, and somewhere is exactly where I fish. So I keep trading, at a tighter risk ceiling, and I avoid the mega-caps and index ETFs that are the ones actually breaking.
Yellow is the reverse, and it's the dangerous one. The headline index is above a rising average, the news is calm, nothing looks wrong, and underneath it all the average stock has already rolled over. Yellow is where I used to do my worst damage, buying breakouts into a market that had quietly stopped supporting them. The light doesn't ban entries in Yellow, but it reduces them to A+ setups in strong groups at reduced size, which in practice means most weeks I take nothing.
What the light actually governs
The light doesn't tell me to "be careful." Careful isn't an instruction. It sets numbers I don't get to argue with.
The open risk ceiling. 5% of the account in Green, 3% in Amber and Yellow, zero in Red. If a new entry would push total open risk past the ceiling, it isn't taken until something is trimmed, stopped, or moved to breakeven.
Which entries are even available. All four types in Green and Amber. In Yellow, first entries only, with no adding to a position that's already working. In Red, nothing.
Where I take profits. In Green I trim 40% at a 7 ATR extension and 30% at 8.5. In Amber those come in to 5.5 and 7. Same stock, same setup, different exit plan, because the environment is different.
How many positions I can hold. Seven, hard cap. An eighth open position is a disqualifier before any other consideration is reached. Seven, because past that I'm not running a portfolio, I'm running a mood.
That's the difference between a rule and a resolution. A resolution is "I'll be more disciplined." A rule tells you the number.
The second throttle: my account's condition
Here's the part I think matters more, and it's the one almost nobody builds.
The Traffic Light reads the market. It has no idea how I'm doing. And a trader in a drawdown is a different animal from the same trader at a high: more likely to reach, more likely to widen a stop, more likely to want it back. The market being green has nothing to do with whether I'm in a state to press.
So there's a second set of governors that reads my own equity curve:
| Portfolio drawdown | What happens |
|---|---|
| 10% | Risk per entry drops from 0.5% to 0.35%. Otherwise trade normally. |
| 15% | Risk drops to 0.25%. First entries only, no adding to winners. |
| 20% | All new entries halt. Manage what's open. A full weekly review before re-engaging. |
These aren't suggestions I consult. They're automatic, and the reason they're automatic is that the moment they trigger is precisely the moment I'd argue with them.
The line I keep coming back to: the correct response to a drawdown is smaller size, not different rules. Every losing stretch tempts you to change the system. What actually needs to change is how much you have at stake while you find your feet.
What this is protecting me from
Not the market. Me.
February this year was the worst month I've had. The account fell seventeen percent. When I went back through it, the trades I'd chosen were net positive. My selection was fine. I lost seventeen percent of the account in a month where I picked reasonably well.
It was sizing. Big money on the ones that failed, small money on the ones that worked. No ceiling, no governor, nothing between me and my own enthusiasm.
Everything above came out of that month. It isn't clever and none of it is a secret. It's a set of numbers written down while calm, so that the version of me who's excited about a chart on a Tuesday night doesn't get to choose the size.
The part underneath
I'll say the quiet thing plainly, because it's the reason I bother.
The account isn't mine. I'm a steward of it, not its owner, and that changes what I'm willing to risk in a way no risk framework arrives at on its own. A ceiling isn't only a mathematical decision about ruin probability. It's a decision about what I'm prepared to put at stake that isn't only mine to lose.
It's much easier to let off the gas when you're not trying to prove anything.
This is how I run my own account. It isn't advice and it isn't a recommendation. My risk tolerance, my timeline and my account are not yours. Take the idea if it's useful and build your own version. The full disclaimer is here.
Every Saturday I publish the week's light and what I actually did about it. That's The Saturday Review.